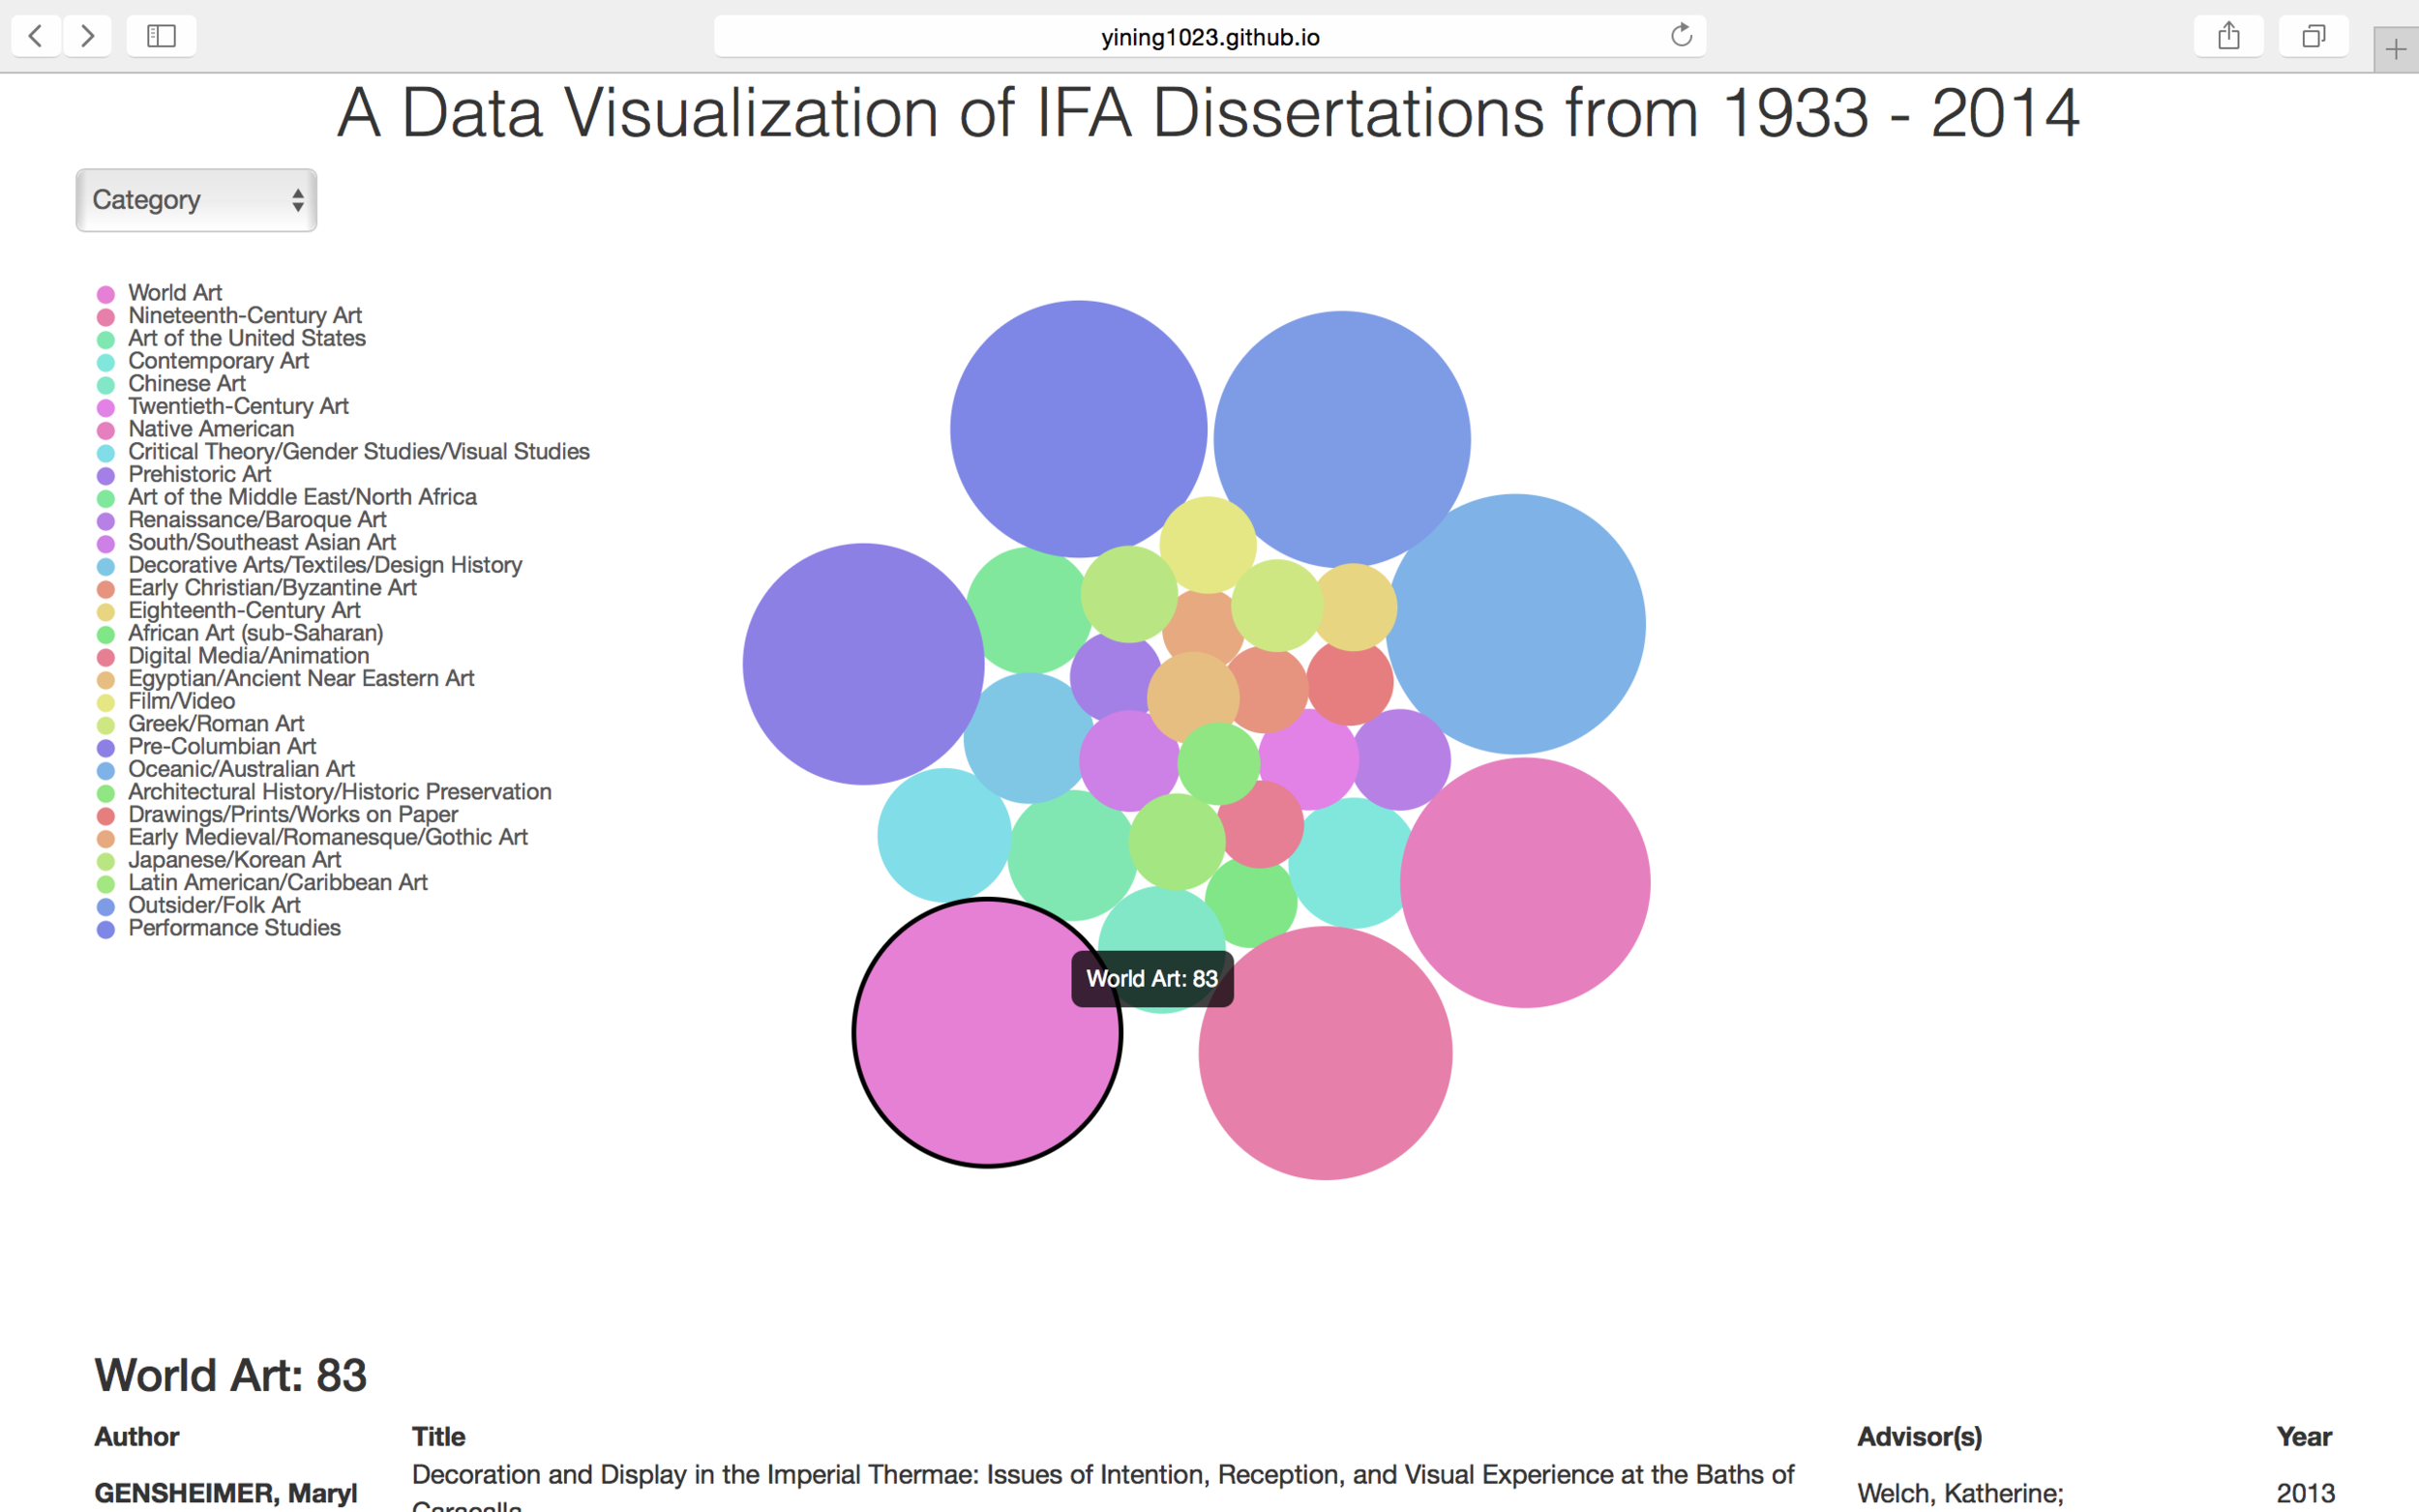
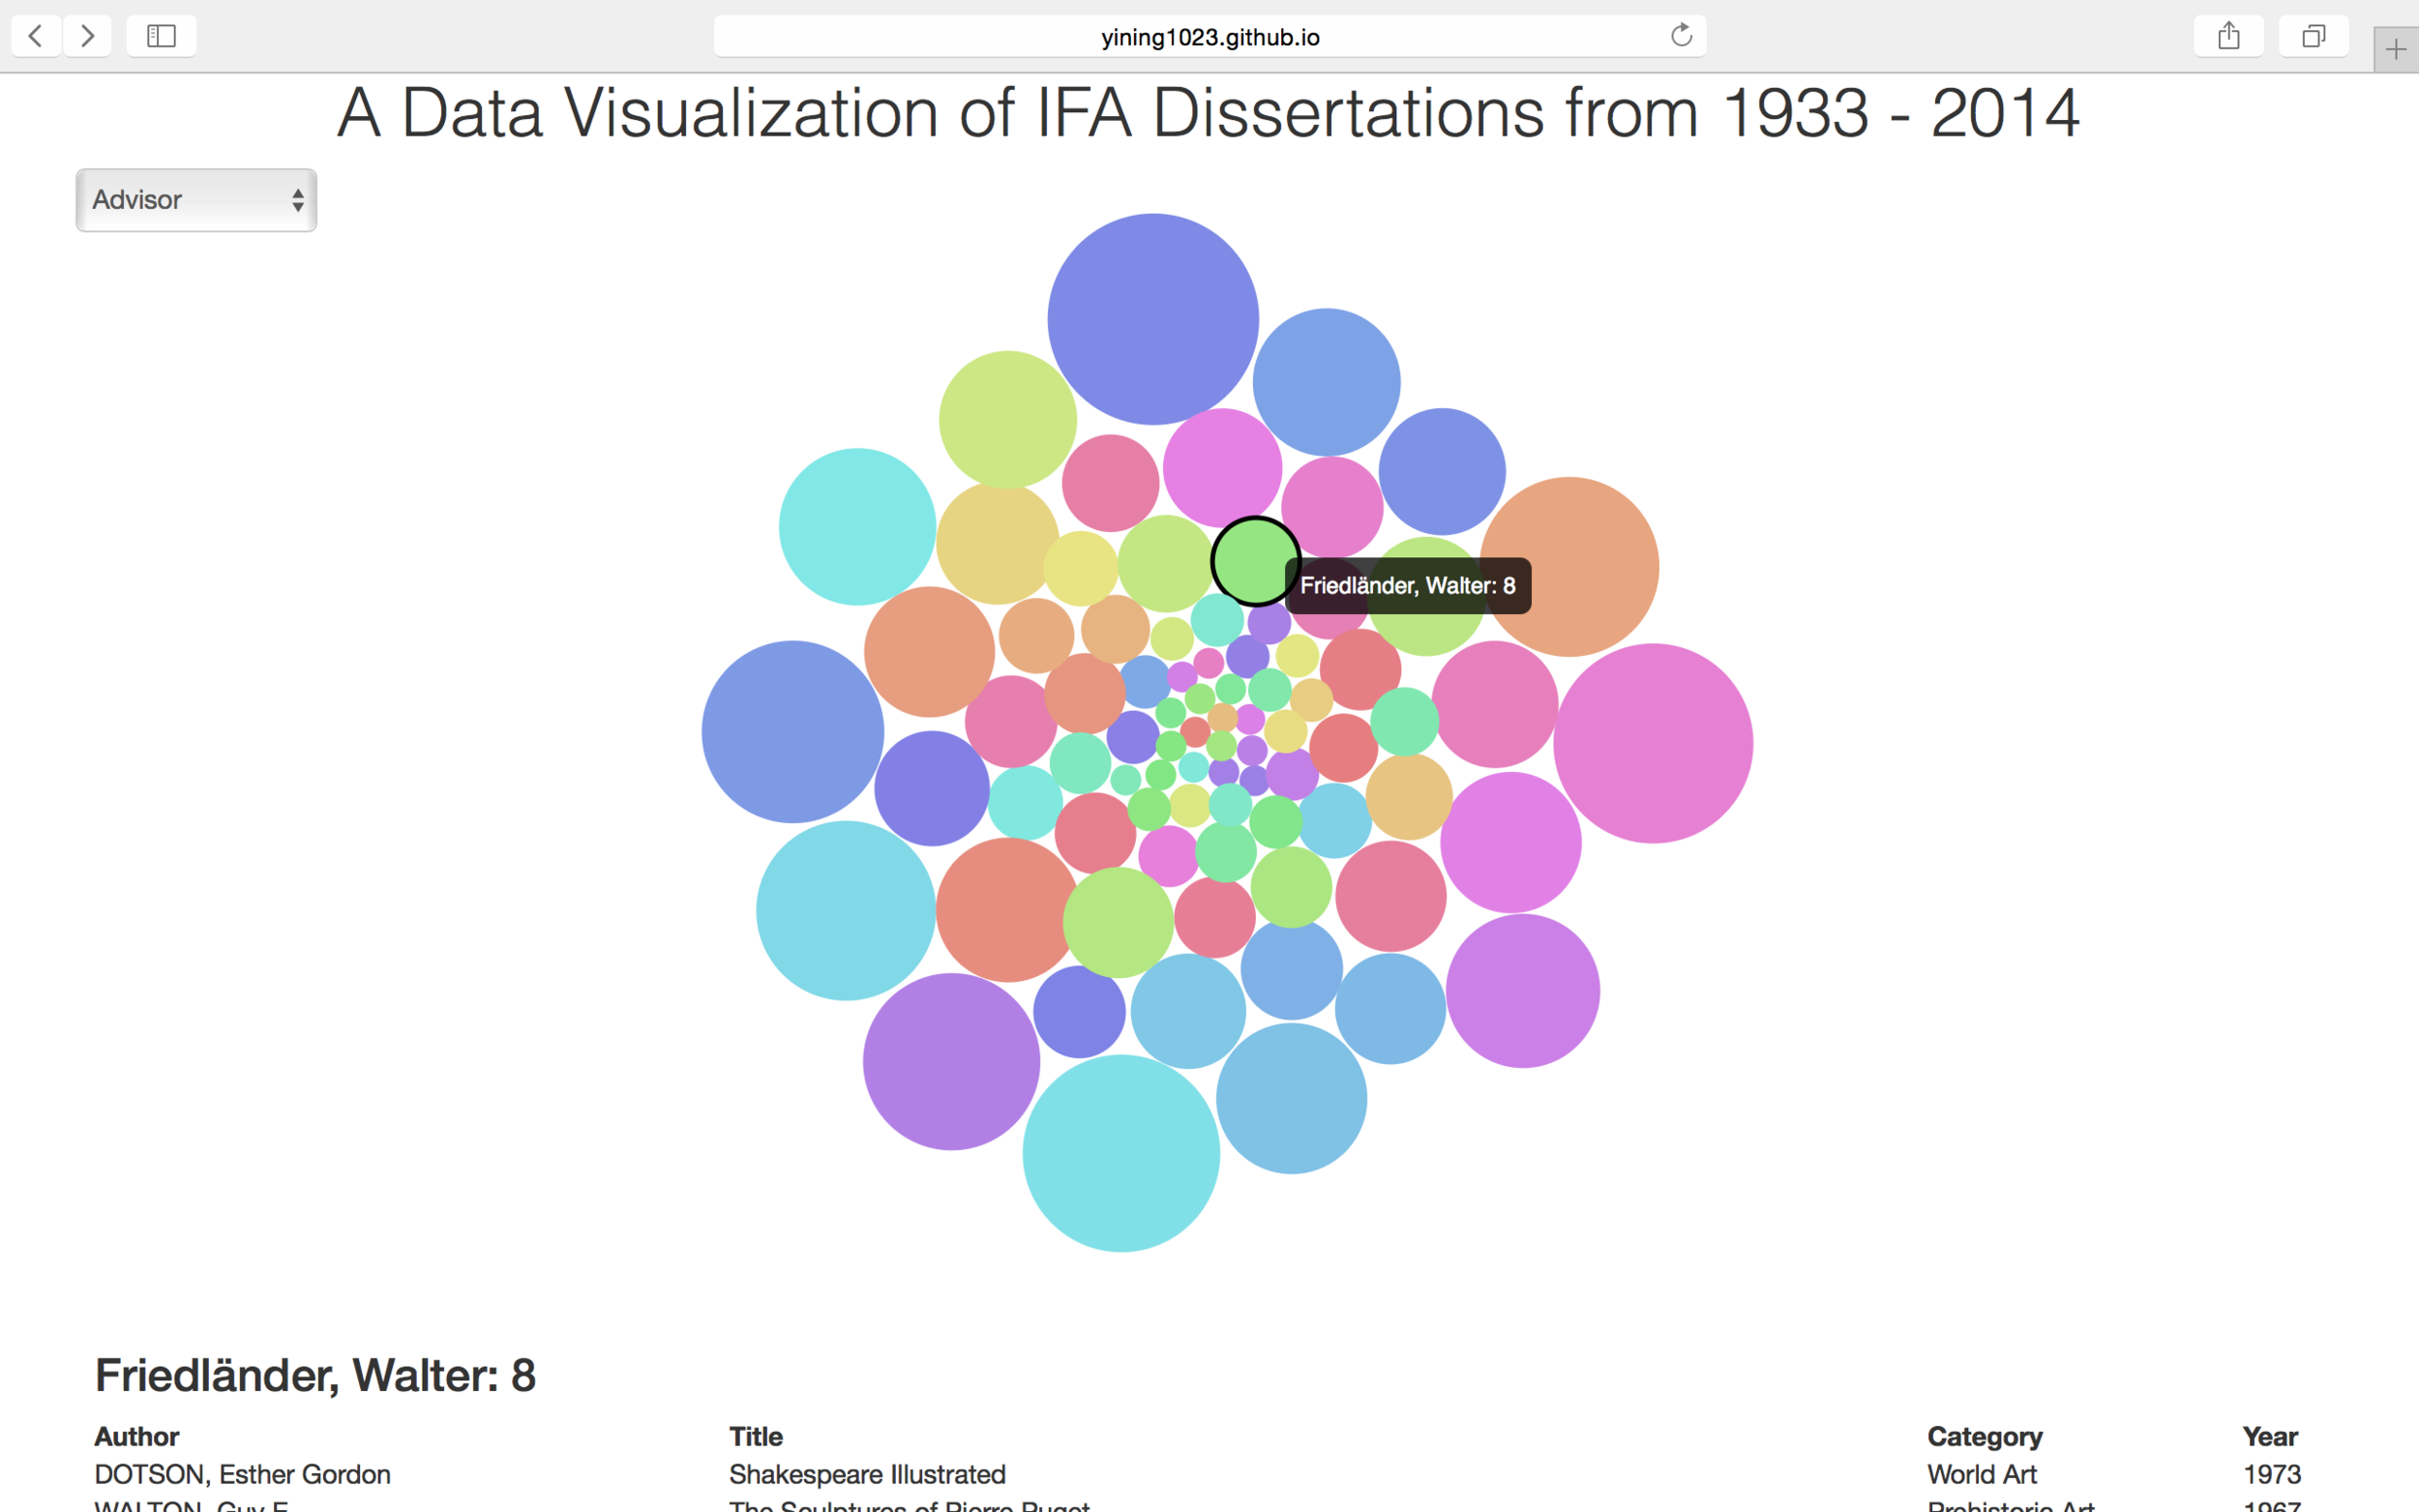
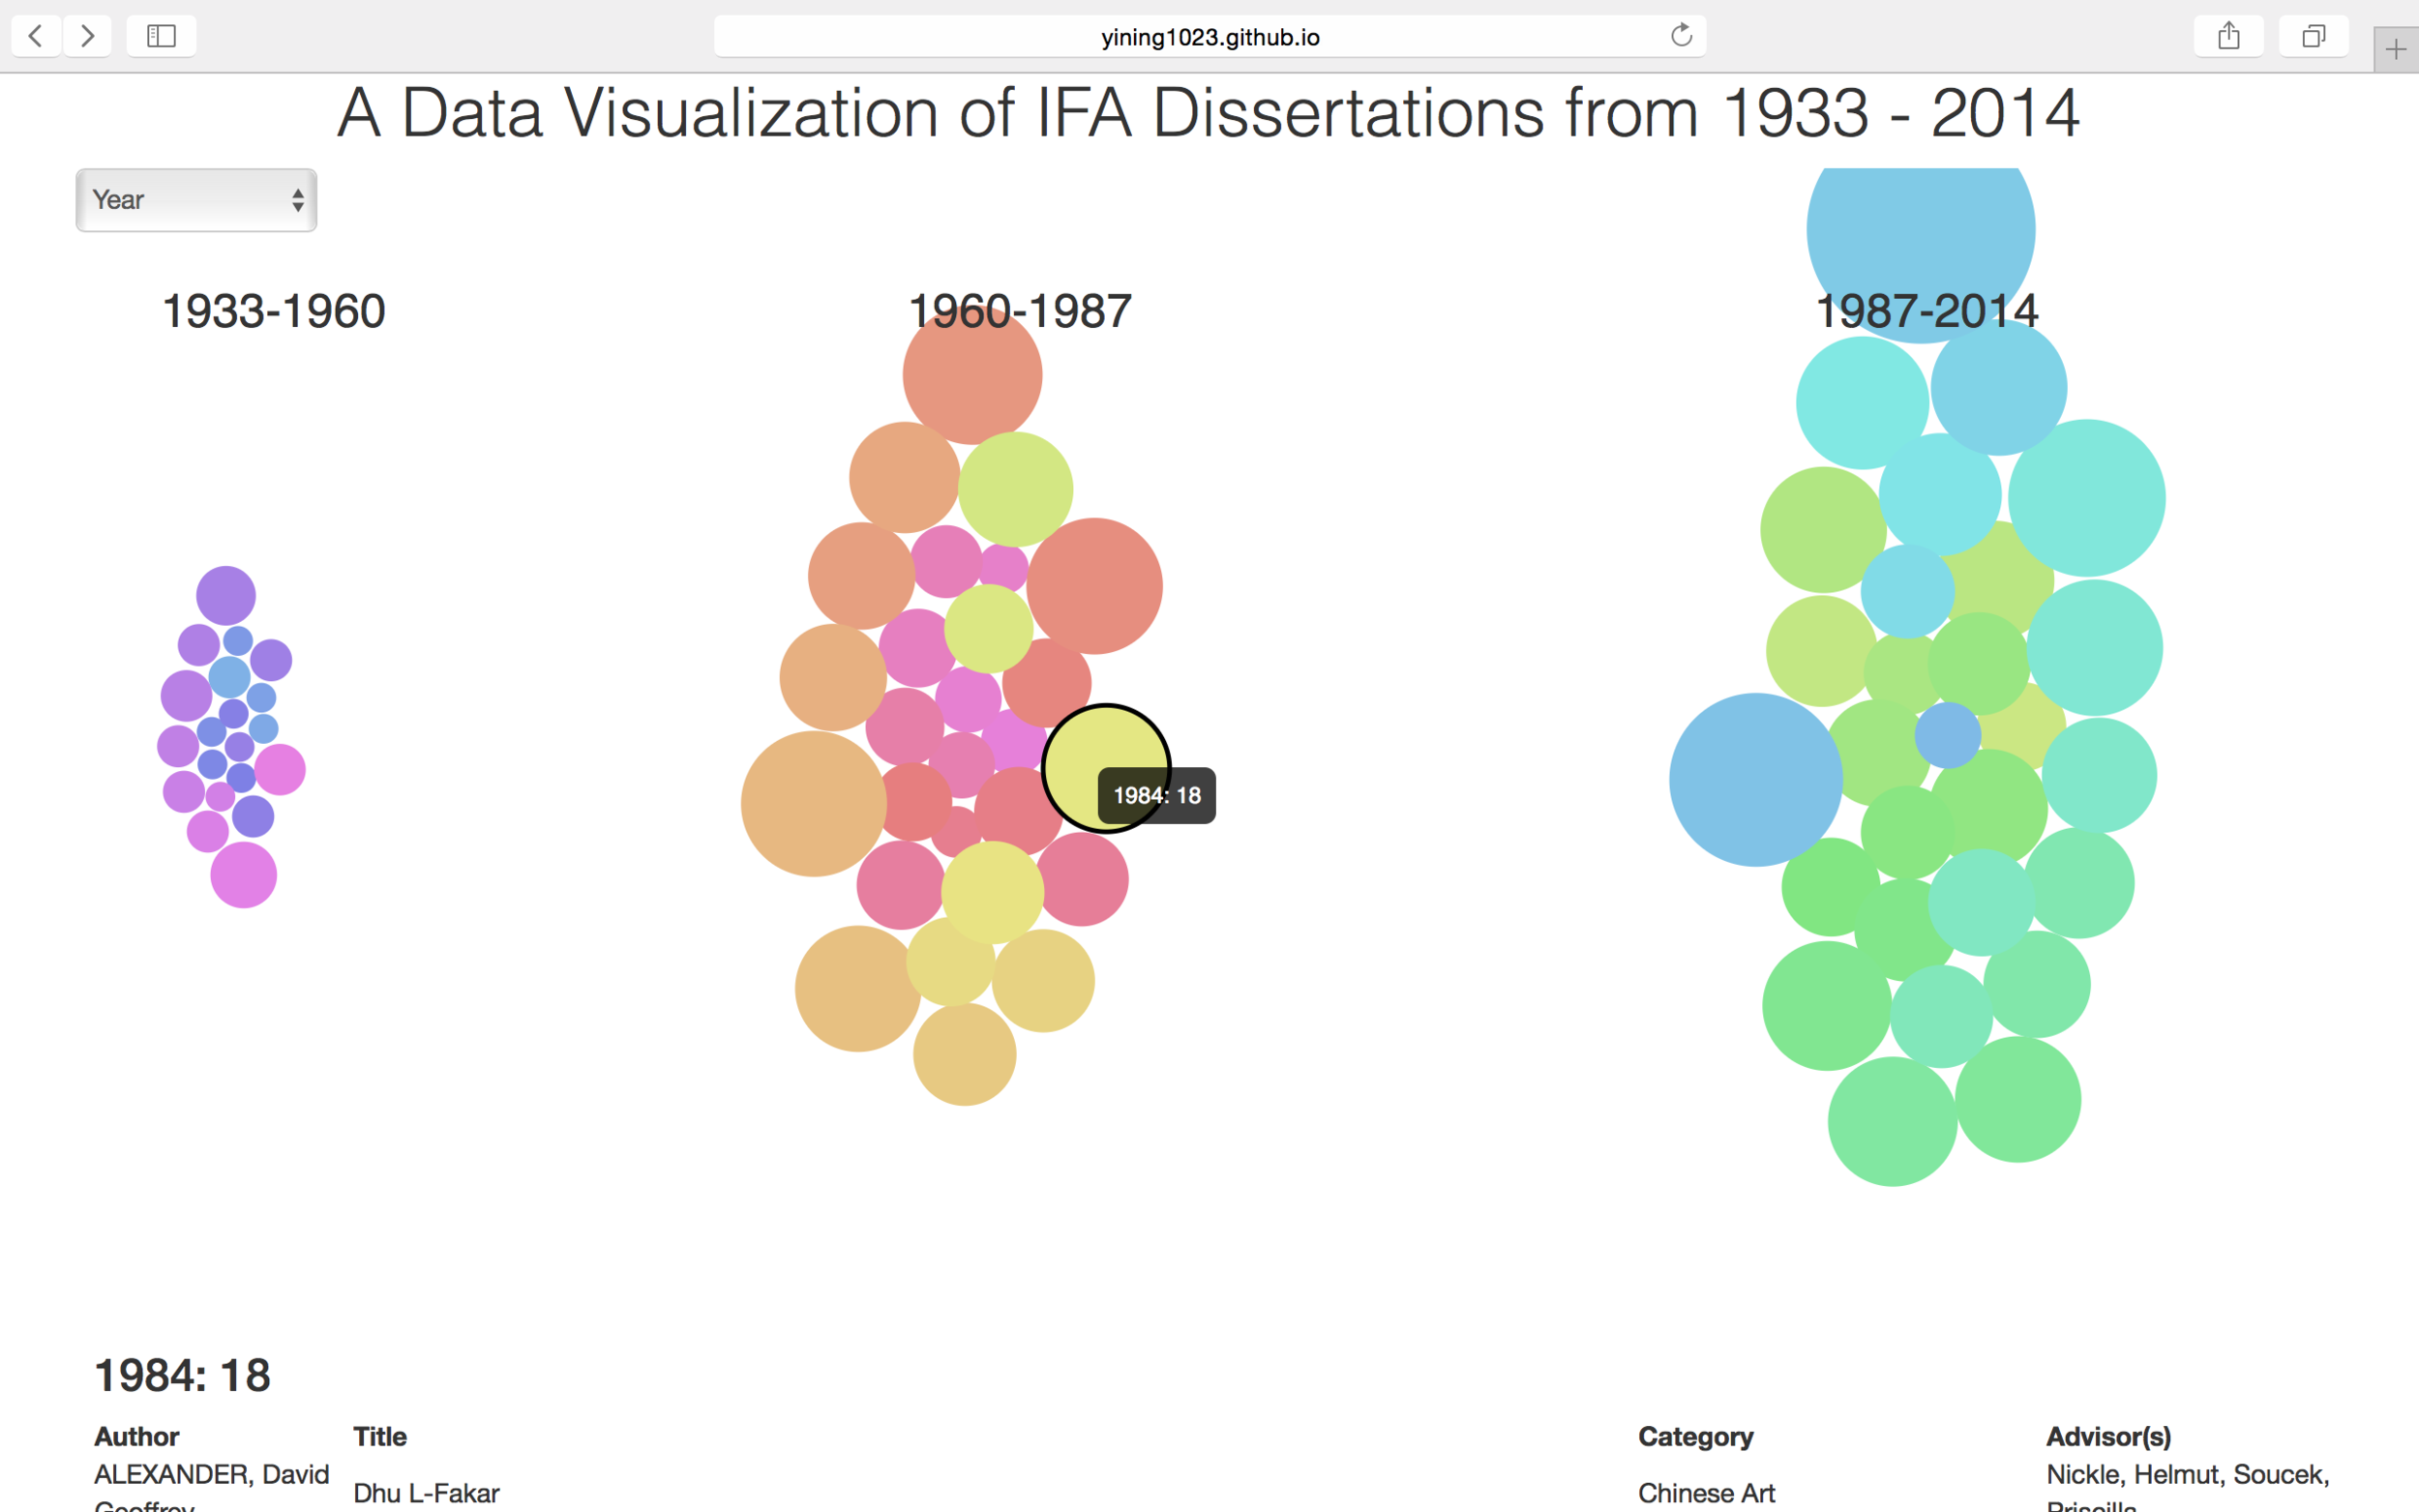
A Data Visualization of 813 Dissertations in Institute of Fine Arts, NYU from 1933 - 2014 (in progress)
#d3.js #d3.force.layout #Javascript #Bootstrap
You can interact with this visualization here: http://yining1023.github.io/IFA/projects/ifa-dissertation/
People can view all dissertations sorted by Category, Advisor or Year. For each bubble, when the mouse hovers over it, it will show detailed information and give a list of all the related dissertations. People can also drag bubbles around. The force and transition effects are applied by using d3.js. I used d3.js to read data from .csv file. I also wrote a function to generate hues that behaves nice gradients.
My code is on my github: https://github.com/yining1023/IFA/tree/master/projects/ifa-dissertation
Here's a demo about the interactive bubble chart.