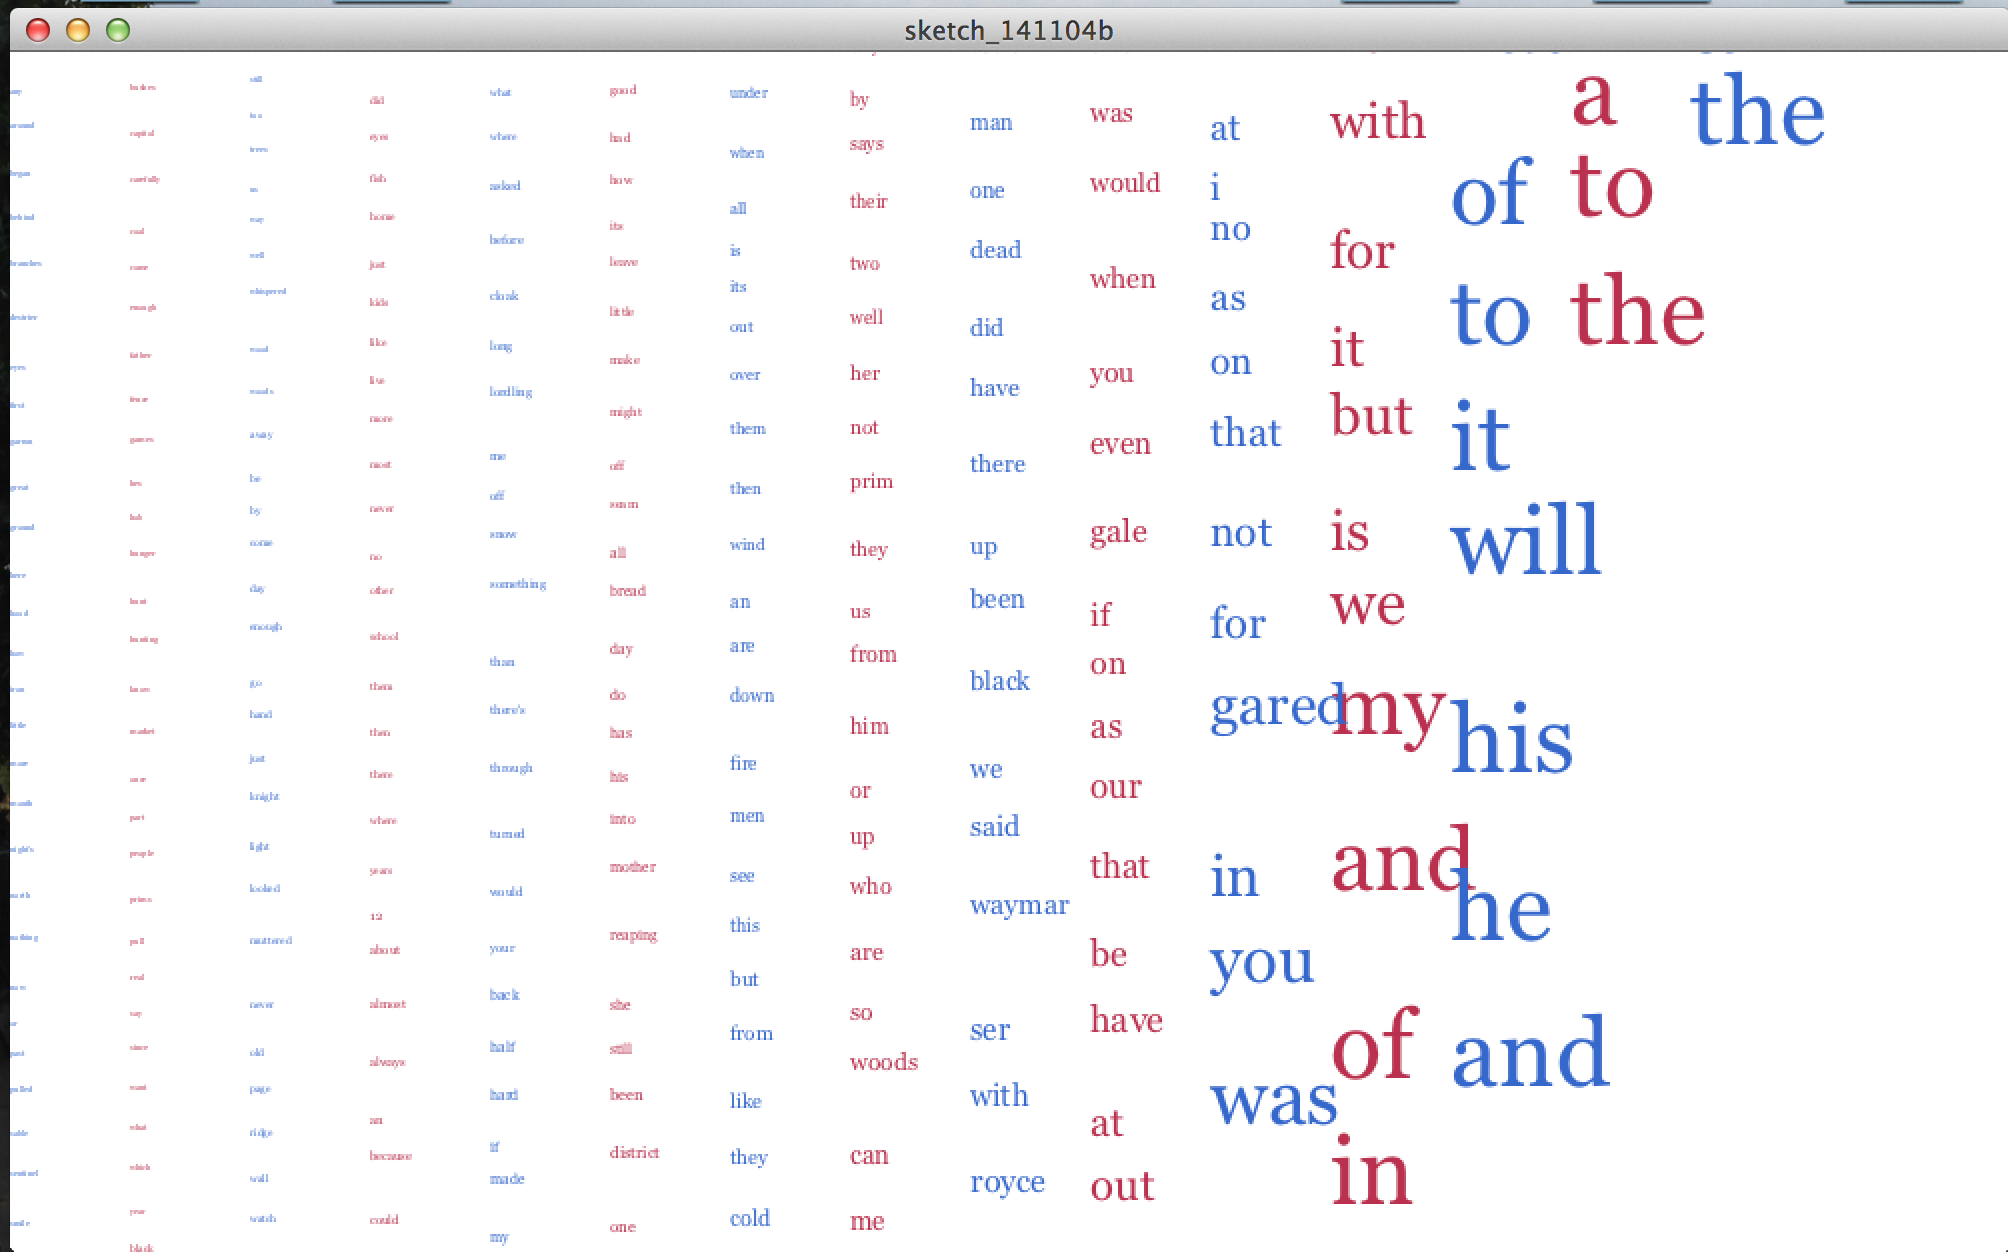
For this week, we learned about data and text. My home work is about counting word frequencies in two different novels (The Hungry Game and The Power of Throne), and visualize the words. For now, the words are arranged by frequency on the y-axis, and the different color represents different novel. Originally, I wanted to draw different size of circles to present different frequencies, and also made them bouncing in the screen. But the problem is that I don't know how to link the circle and the word properly. I'm not satisfied by the visualization, so I'm still thinking about a more interesting way for visualizing the words.

